Debugging
Because all components run in an isolated environment, it may be harder to debug them. There is no way to examine the component while it is running. However, there are some options how the production environment can be replicated locally, so that you can analyze what is happening if something is not right.
Checking Errors and Version
There are two types of errors. In the case of application errors, you (or any other end user) will only see a generic error message in the job result:
Internal Error Something is broken. Our developers were notified about this error and will let you know what went wrong.
At the same moment, you should get a full error message on your vendor channel for receiving errors (typically a Slack or email message). If you have not received a message or you don’t have a channel for receiving errors, contact us to set it up.
Also, if the component is misbehaving, please double check that you are running the correct version. This can be done in the job detail in the section Parameters & Results, where you can see the tag used to execute the job:
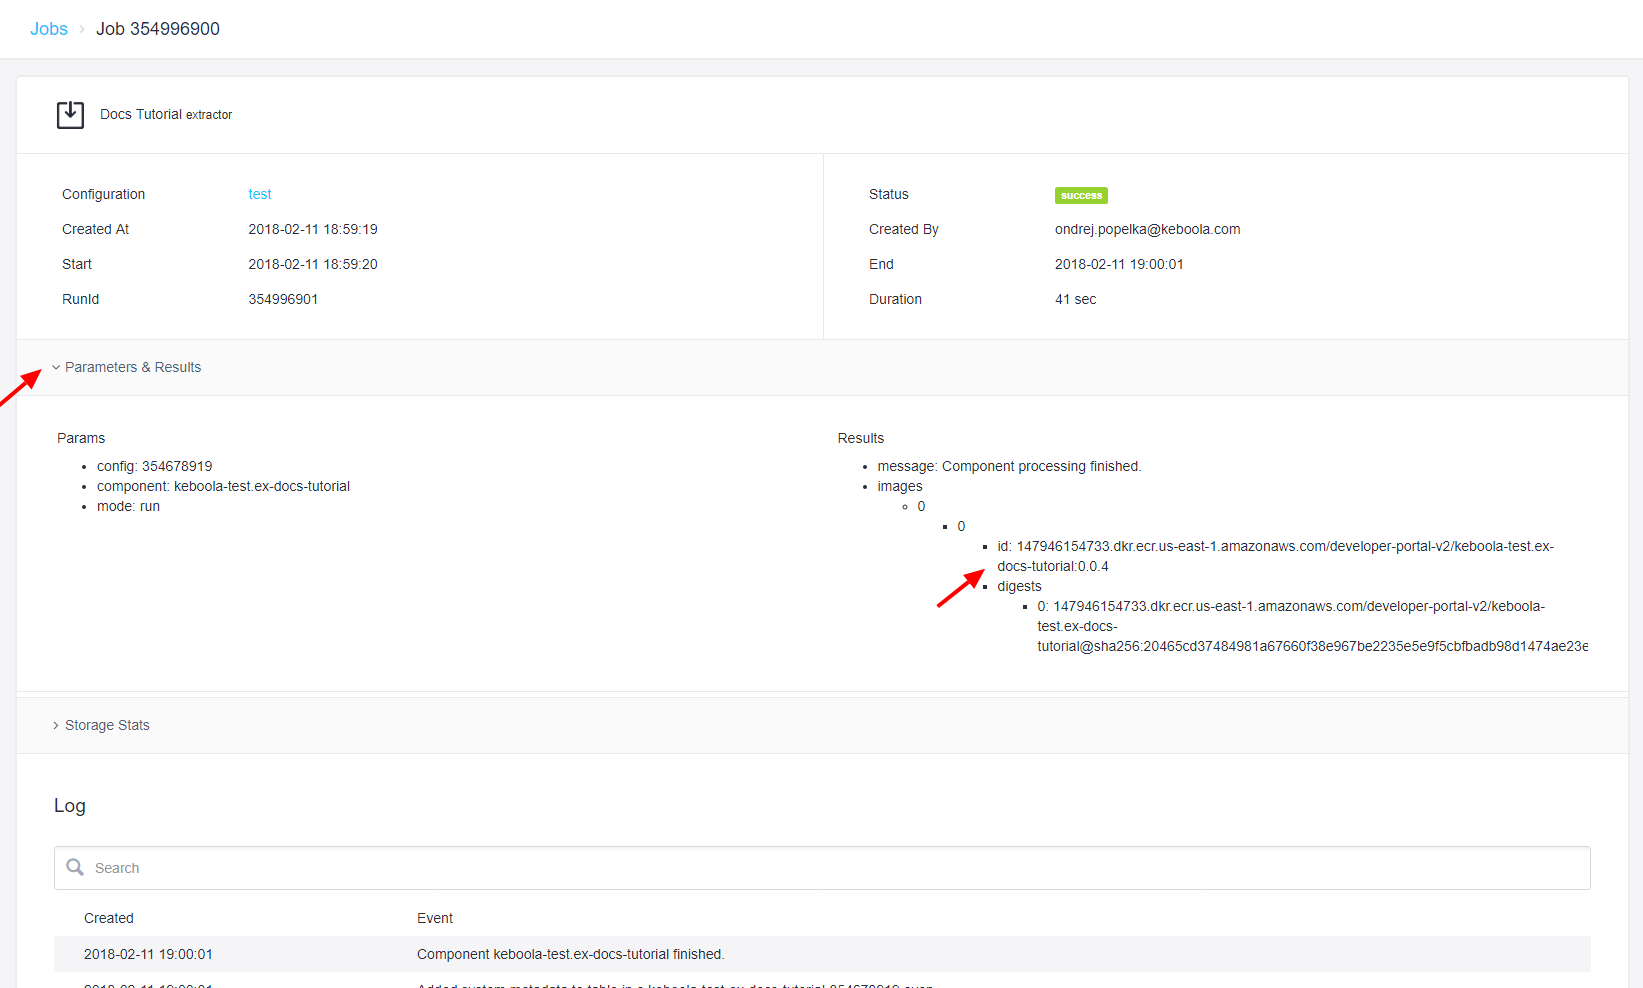
You should be able to trace the tag to a specific version of your source code.
Running Locally
Step 1 – Obtain Sample Data and Configuration
Data between Keboola and your Docker image are exchanged using CSV files in designated directories; they will be injected into the image when you run it. To simulate this, download an archive containing the data files and configuration in the exact same format you get in the production environment.
Use the Create Job API.
You can see it in our API request collection.
In the API call, either specify the
full configuration (using the configData node) or refer to an existing configuration
of the component (using the config node). See an example.
The Run Job API call in debug mode will prepare the data folder for the component, put it inside an archive and upload it to Keboola Storage. When running the request with valid parameters, you should receive a response similar to this:
{
    "id": "176883685",
    "status": "waiting",
    "mode": "run",
    "tag": "1.2.3",
    "isFinished": false,
    "url": "https://queue.keboola.com/jobs/176883685"
}
This means an asynchronous job for preparing the archive has been created.
If curious, view the job progress under Jobs in Keboola.
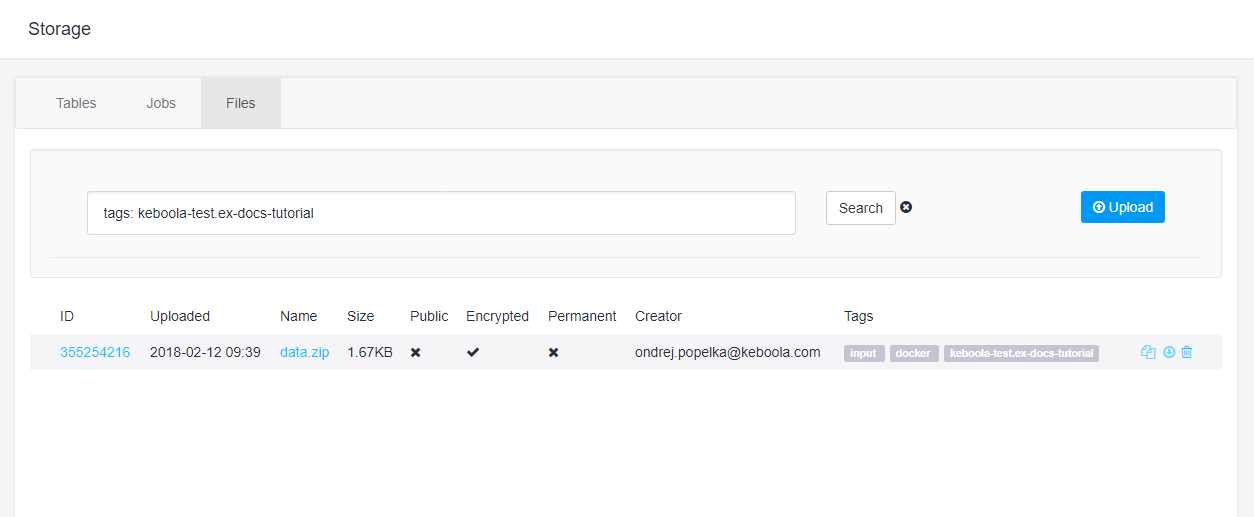
When the job finishes, you’ll see a stage_0.zip file uploaded to your project.
You can send the Run Job API call in debug mode with a reference to an existing configuration id, or you can also supply the configuration directly in
the API request. In such case, use the configData attribute in the request body, e.g.:
{
"config": "my-test-config",
"configData": {
"storage": {
"input": {
"tables": [
{
"source": "in.c-main.test",
"destination": "source.csv"
}
]
},
"output": {
"tables": [
{
"source": "destination.csv",
"destination": "out.c-main.test"
}
]
}
},
"parameters": {
}
}
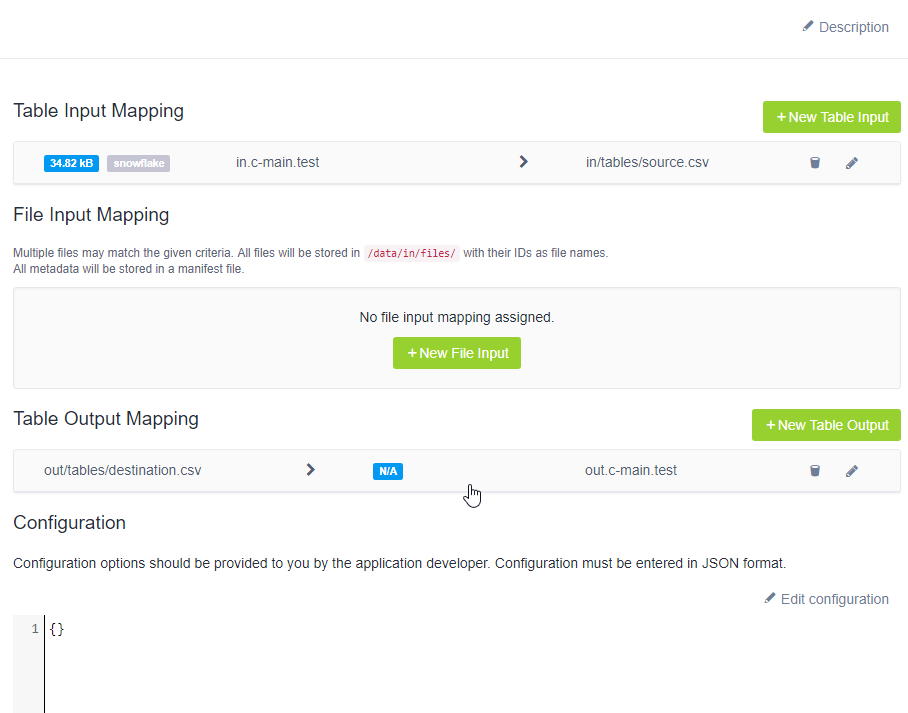
}The above request corresponds to the following setting in the UI:
Step 2 – Build Image
Then you can build your component code locally:
docker build path/to/component/code --tag=my-component
or
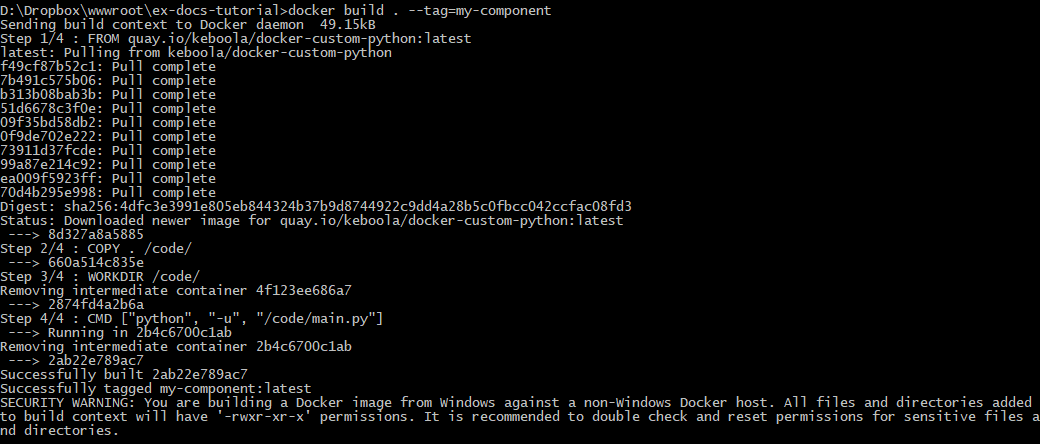
docker build . --tag=my-component
in the component directory. It should produce an output similar to the one below:
Step 3 – Run Component with Sample Data
Once you have prepared the data folder with sample data and configuration, inject it into the Docker image. In addition to the options shown in the example, there are many other options available.
When you run an image, a container is created in which the component is running isolated. Use the following command to run the image:
docker run --volume=physicalhostpath:/data/ imageTag
An image tag is the tag you supplied in the --tag parameter for docker build (my-component in the above example).
The physical host path depends on the system you are running. In our example image with default Windows
installation of Docker, this would be:
docker run --volume=C:\Users\JohnDoe\data\:/data/ my-component
Where the contents of the sample data folder are put in the user’s home directory. If you have set everything correctly,
you should see Hello world from python, and a destination.csv file will appear in the data/out/tables/ folder.

You can then examine what the component did and what files it produced in the data/out folder. You can
also read more in-depth information about running images.
Step 4 – Debug
Chances are that you received an ugly error message or warning. In that case, you might want to check the contents of the image; specifically, if all the files are where you expect them to be.
To work with the component container interactively, use the following command:
docker run --volume=physicalhostpath:/data/ -i -t --entrypoint=/bin/bash imageTag
For instance:
docker run --volume=C:\Users\JohnDoe\data\:/data/ -i -t --entrypoint=/bin/bash my-component
This will override the default command specified in the Dockerfile – CMD ["python", "-u", "/code/main.py"]
to launch Bash instead. The -i and -t flags
ensure that the container runs in an interactive mode.
You can then inspect the container contents: ‘ls /data/’.
Step 4 – Modify
Chances are that you want to modify the component code often. If you modify the component code, you have to rebuild the docker image. To avoid the slow and tedious work, run the image with the following command:
docker run --volume=physicalhostpathtodata:/data/ --volume=physicalhostpathtocode:/code/ -i -t my-component
For instance:
docker run --volume=C:\Users\JohnDoe\data\:/data/ --volume=D:\wwwroot\ex-docs-tutorial\:/code/ -i -t my-component
This means that the directory with the component code will shadow the one inside the image (defined by the COPY . /code/
instruction in Dockerfile) and you will run the current code in the image environment.
Running Specific Tags
The Run Job API call in debug mode is very powerful but it always runs the production version of the component. There are cases where you might want to run a test or development version of a component. In such situations, an alternative may be to run a specific image tag.
Let’s say that you need to list all files on input for some reason. Following the example component, you would have to add something like this to the component code:
from os import listdir

mypath = '/data/in/tables'
onlyfiles = [f for f in listdir(mypath)]
print(onlyfiles)
Since you are debugging, it is not wise to add this for all customers. Therefore you can commit
the code and tag it with a non-normal version tag, for example, 0.0.7-test.
Such a tag will be deployed as a Docker image, but it won’t (automatically) update in the
Developer Portal. That means the previous tag will be still used for all jobs. However, you can
run the new tag manually, using the Run Job API call. Again, feel free to use our collection.
If you added the above debug code to the component keboola-test.ex-docs-tutorial and
tagged the release 0.0.7-test, you can run the configuration 354678919 by issuing the
following API call:
curl -X POST \
https://queue.keboola.com/jobs \
-H 'Content-Type: application/json' \
-H 'X-StorageApi-Token: your-token' \
-d '{
"component": "keboola-test.ex-docs-tutorial",
"config": "354678919",
"tag": "0.0.7-test",
"mode": "run"
}'
In the job detail – under Parameters & Results, , you’ll see that a specific tag was requested. In the job events, you can then
see that it was indeed used and that the script printed out all files in the /data/in/tables/ folder.
Summary
You can find more information about running components in the corresponding part of the documentation.
This concludes our development tutorial on the most important aspects of creating Keboola components. However, our platform offers a lot more; we encourage you to read about other features in our documentation:
- exchanging data in data folders
- manifest files
- OAuth support
- or general information about the common interface
- deployment settings
- UI settings
- Running components locally